
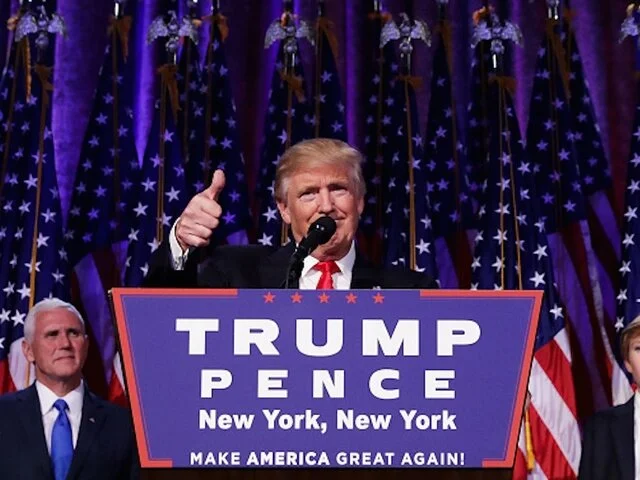
How Did This Happen?
*This article does not seek to diminish the concerns about nor normalize a Trump presidency. Instead it aims to investigate the voting trends that resulted in his election, from a statistical perspective.To many, Tuesday night’s results were shocking. Very few predicted a victory for President-elect Trump, and even fewer anticipated a win by such a margin. Even the "prophetic" Nate Silver, currently taking a victory lap, gave Trump less than a one percent chance of winning Michigan, Wisconsin, and Pennsylvania in his final model. In fact, Trump’s transition team was so resigned to their candidate’s impending loss that they failed to adequately organize a plan for what to do once he assumed office. Nevertheless, Trump won, leaving us with the question of how this all happened.How were the polls so wrong? How did a sure-fire victory turn into a loss? These questions continually cascade; gallons of ink will be spilled in the coming years to try to answer them. However, I hope to address them by adhering to the legal principle of “non remota causa sed proxima spectatur,” looking for the proximate causes rather than remote. Three primary trends in polling data explain the Trump victory: an enthusiasm gap, a dichotomy between the strength of the two candidates’ “firewalls,” and surprisingly strong Trump performances in key demographics.Polling data points to a significant enthusiasm gap between Trump and Clinton supporters. While Clinton supporters took the time to respond to pre-election polls, Trump supporters who were more willing to make the trip to the ballot box. Take a look at this chart (blue is Democratic turnout, while red is Republican): While Republican turnout has remained relatively stable in the last three elections, Democratic turnout has experienced a sharp decline. Some pin this decline on a Republican voter suppression effort that is treated as a political hurdle rather than a continuation of racist suppression tactics throughout America’s history. However, there is evidence that the enthusiasm gap was real. A New York Times/CBS News poll, for example, found that 45 percent of Trump supporters were “very enthusiastic” compared to just 36 percent for Clinton. A less common refrain for the low democratic turnout is the polling itself. Additionally, unenthusiastic Clinton supporters may have viewed the election as a surefire victory and neglected the effort of actually going to the ballot box.Another factor that led to Trump’s election was the difference in strength between the two candidates’ firewalls. In the previous six elections before 2016, 13 states had voted for Democrats every time, representing 242 electoral votes. On the other side, 8 states voted Republican every time, representing just 102 electoral votes. Here are the firewalls:
 Clinton was extremely confident in her firewall, as it contained the three key states of Pennsylvania, Michigan, and Wisconsin. Going off of polling data that gave her a strong lead, Clinton barely stepped foot in the rust-belt during her campaign. Meanwhile, Trump made the unorthodox decision of vigorously campaigning in these states. In the end, Clinton’s firewall cracked while all 8 of Trump’s firewall states held strong. A significant reason for this was white evangelical voters’ commitment to Trump. Many predicted a disconnect between the thrice married, boisterous Trump and the white Christian vote. However, Trump did even better among these voters than Romney or McCain, as 81% of white evangelical or born-again Christians voted for him. The rest of the country, meanwhile, voted 59%-35% in favor of Clinton. Another cause for Clinton’s failure in the rust belt was her loss of the lower and lower-middle class. Nationally, among voters earning less than $30,000 a year she performed 16 percentage points worse than Obama. Among voters earning between $30,000 and $50,000, she performed 6 percentage points worse than he did. Trump’s maintenance of the White evangelical vote combined with Clinton’s loss of the lower and middle class combined to crack her firewall, while his persisted.
 Finally, Trump’s victory can be attributed to surprisingly strong performance among minority groups. Despite accusations of racism towards Hispanics and Blacks, Trump outperformed Romney among both of these groups. He performed 7 percentage points better among black voters and 8 percentage points better among Hispanic voters. Similarly, Trump only underperformed against Romney among women by 1 percentage point, despite the release of a misogynist video just weeks before the election. Overall, Trump was able to keep a hold of or strengthen traditionally Republican demographics while also making inroads among traditionally Democratic groups. His victory can be attributed to an enthusiasm gap, the relative strength of his firewall, and his surprising margins among these groups.Images via, via, via, via